Filters
Quickly narrow down data using the available filters:- Agent Filter – View metrics for specific agents.
- Date Filter – Select custom date ranges to analyze performance over time.
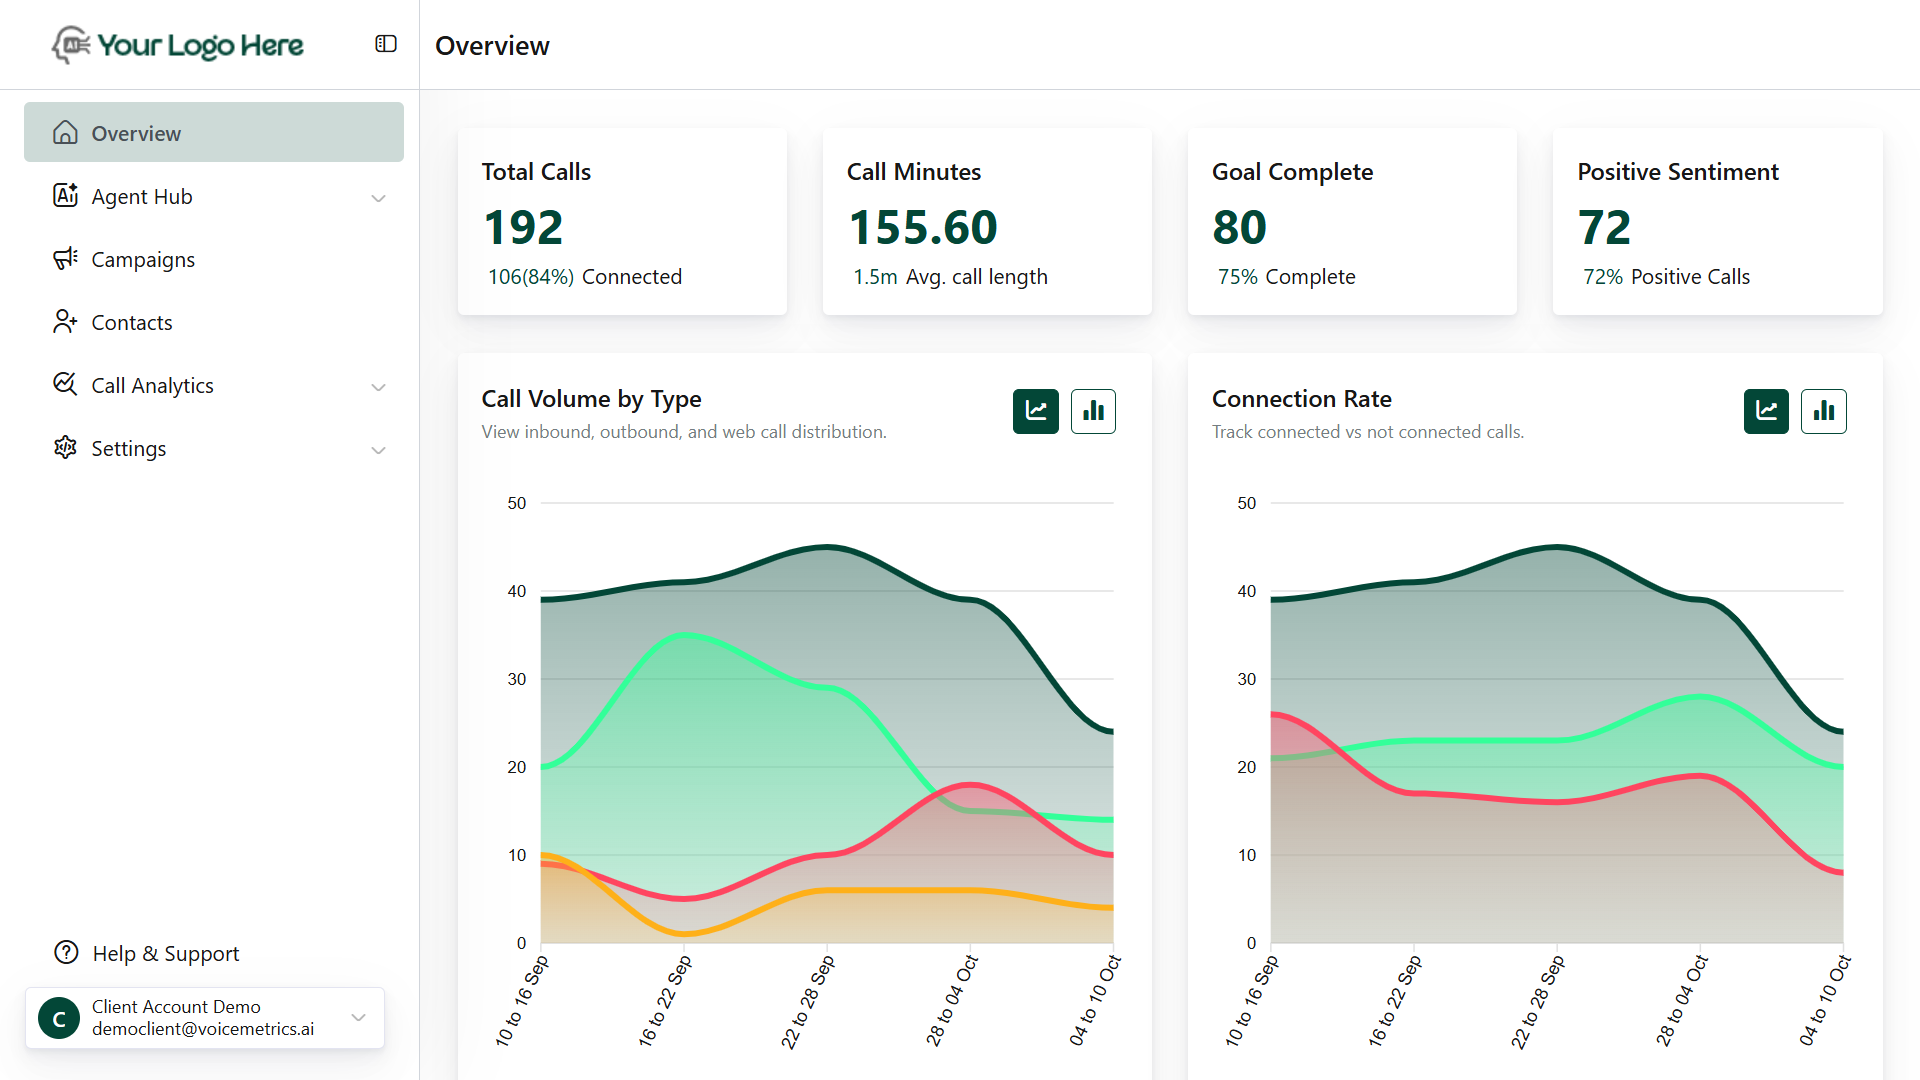
Overview Info
The top summary cards provide a snapshot of platform performance:Total Calls
- Number of total voice conversations initiated or received. e.g., 24 Calls | 100% Connected
Call Minutes
- Total time spent on calls and the average call duration. e.g., 45.18 minutes | 1.9 min Avg. call
Goal Completed
- Calls achieving intended objectives (e.g., booked appointment, captured lead).
e.g., 12 Completed | 50% Success Rate
Positive Sentiment
- Calls marked as having positive caller sentiment, as determined by AI analysis.
e.g., 24 Positive | 100% Positive Calls
Graphical Reports
Visual insights help understand trends at a glanceCalls by Type
- Breakdown: Total, Inbound, Outbound, and Web calls. Tracked across selected dates
Calls by Status
- Breakdown: Connected vs Not Connected
Optimize retries, improve connect rate.
Calls by Goal Status
- Breakdown: Goal Completed vs Incomplete
- Identify what % of calls achieve their outcome
Calls by User Sentiment
- Breakdown: Positive, Neutral, Negative
- Monitor caller satisfaction and emotional tone
Data Tables
Detailed breakdown for in-depth analysis:Call Ended by Reason
- Shows call end reasons (e.g., user hang-up, agent transfer, no response) Columns: Reason, Call Count, Call Minutes
Call Minutes by Agents
- Track performance and talk time for each agent
- Columns: Agent Name, Call Count, Total Call Minutes